What a year! 41 events supported, and an average landfill diversion rate of over 95 percent with no waste sent to incineration. According to the Zero Waste International Alliance, and as a commonly used definition, a diversion rate of over 90 percent is considered “zero waste.”
Many thanks to my clients RF Events, Epic Races, the Ann Arbor Track Club and others, who have made the additional investments to recycle, compost, and reduce event waste rather than send it all to landfill. And the athletes appreciate it too, as evidenced by the thanks and support we get from them at every event.
Thanks also to TerraCycle, whose Zero Waste Boxes and programs allow us to recycle many things we’d normally have to throw away, such as Gu wrappers, disposable gloves, party supplies, hand warmers, and much more.
See below for highlights and lots of juicy data for those of you who like numbers like I do. And if you want to see more, check out the sustainability reports on this website. The 2019 events are all there!

2019 Highlights and Achievements
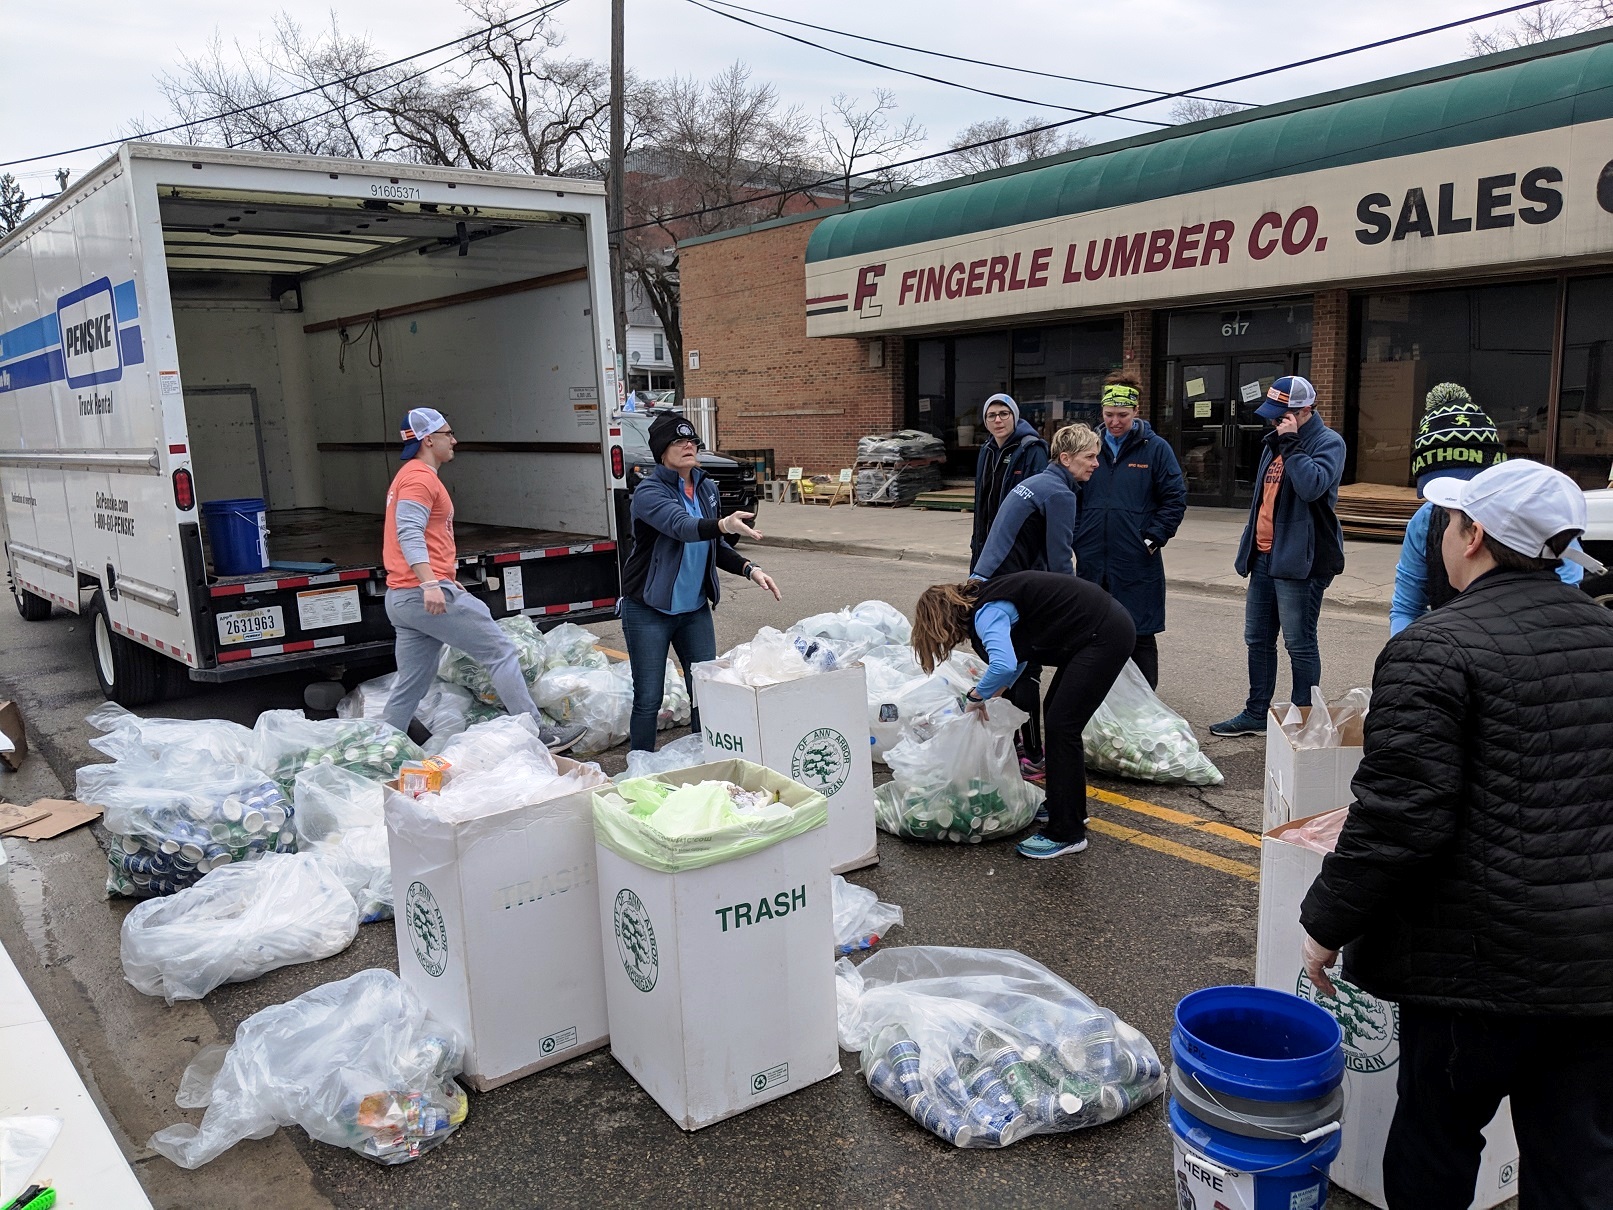
- Switching to a central “pod” of stations improved real-time sorting even with fewer volunteers.
- We had several events with total landfill of less than one pound.
- Talks and presentations: Webinar for USA Triathlon, sustainability panel at the U.S. Trail Running Conference, composting talk at Frost Middle School.
- Created Zero Waste Guides for aid stations and food vendors.
- Three races (Trail Marathon, Flirt with Dirt, The Legend) were successfully “cupless”.
- Using 96-gallon carts for beer cans (Oberun), pizza boxes (DWD-Hell, Dexter-Ann Arbor), and food (Scrumpy) reduced changeouts.
- Taking recyclables to a dropoff center instead of using rolloffs reduced cost and simplified logistics.

Of particular note: The largest races we supported – 4,000+ participants (Martian Invasion, Dexter-Ann Arbor Run, RF Turkey Trot) – had diversion rates above the average (98-99%) with landfill waste of less than one ounce per participant.

Opportunities for Improvement (there always are!)
- Make more events cupless or reduced-cup. Silicone cups carried by runners are becoming more popular as swag.
- Consider alternatives to individually wrapped snack bags. They often still contain food, or are stuffed with other waste by the athletes, and they take up a lot of space in the waste stations. They are also costly to recycle and therefore are landfilled at larger events.
- Consider reduced use of disposable water bottles. They are often discarded with liquid still in them, and loose caps are troublesome to recycle and create litter.
- Train aid station crews to sort better. It is messy and takes time at takedown (or afterward) to pull Gu wrappers, plastic bags, and non-recyclables out of bags of cups.
Trend Analysis
Note: Happy Planet Running was incorporated in 2017, but I supported Running Fit Events races in 2016 as a volunteer, and the trend charts include that year’s data.
 Total waste decreased 2% from 15,873 lbs. in 2018 and 1.5% from 15,785 lbs. in 2017, even with a higher number of events (41 vs. 35 and 30).
Compost weight increased as more use was made of compostable materials (cups, plates, utensils, etc.) instead of waxed or plastic materials.
Total recycling weight decreased due to greater use of compostables and reductions in material use (e.g. the cupless events). The cupless effect was greatest at The Legend, with a 57 percent reduction in recyclable weight.
Landfill decreased slightly from 2018 but remains higher than 2017 due in part to no longer recycling snack bag wrappers. (The cost of the Zero Waste Box became prohibitive.)
 Average waste per event and per attendee continued to drop, as total waste decreased and number of events and total attendance increased. Only one event (Run Woodstock) had more than one pound of total waste per attendee.
Individual Events Analysis
For individual events, 2018-2019 changes in waste totals ranged from a 53 percent decrease (Martian Invasion of Races) to a 61 percent increase (RF Events Turkey Trot). Note that total waste can fluctuate based on attendance, weather, and other factors. The increase at Turkey Trot was not due to wasteful practices.
A chart of waste stream totals per event is below. (Click on the image to see a larger, more readable version.)

